
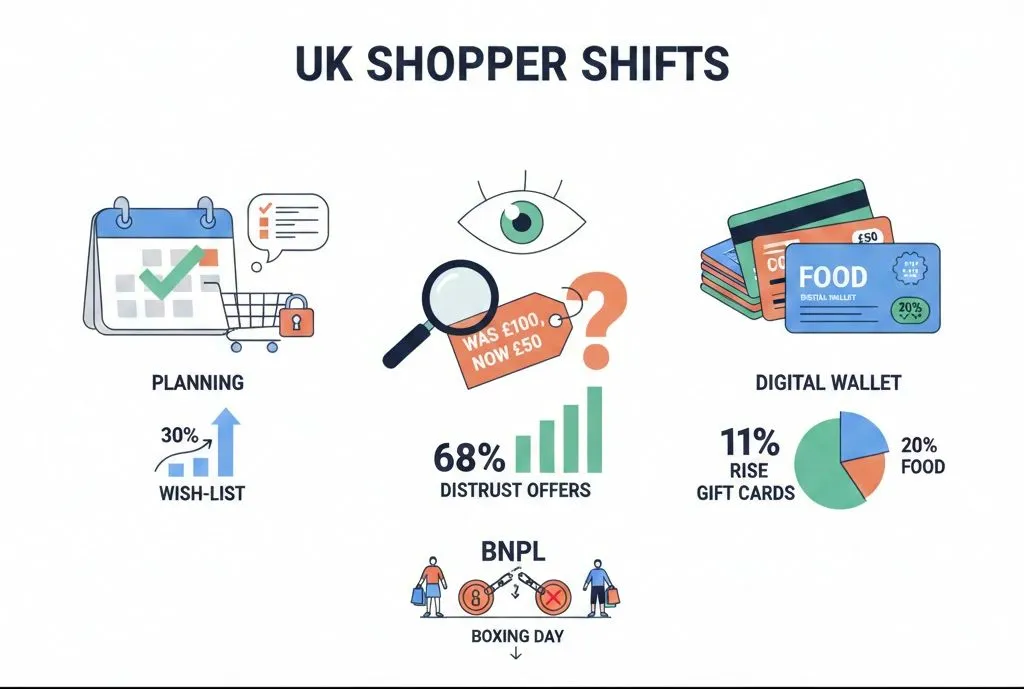
- UK shoppers moved from impulse buying → planned purchasing!
- Sales events are now treated like planned operations, not shopping sprees!
- Consumers increasingly research, track prices, and pre-select items!
- Trust in retail discounts fell sharply — 68% doubt deals are genuine!
Something shifted in how British people shop between 2023 and 2025. The numbers tell a story of a nation that got burned by debt, wised up to fake discounts, and started treating sales events like military operations rather than shopping sprees.
Black Friday 2025 saw record transaction volume — Nationwide recorded 11.9 million transactions in the period — but the impulse buy is more or less dead. Weeks before the sales began, 30 percent of shoppers had wish-listed specific items. An additional 18% purposely deserted baskets to see if retailers would send price-drop emails. And 68 percent said they simply didn’t believe the discounts were real.
That scepticism didn’t appear from nowhere. It grew from three years of rising debt, missed BNPL payments, and January mornings spent calculating how long Christmas would take to pay off.
The Debt Numbers Nobody Wanted to See
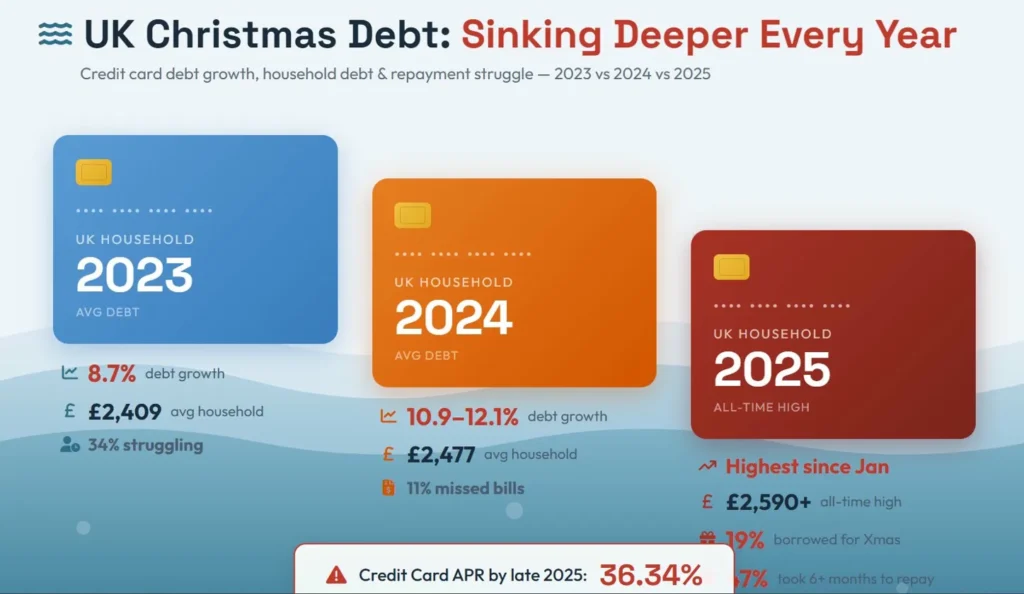
Credit card debt growth accelerated every single year from 2023 to 2025, and not by small margins.
The 2025 figure of 19% borrowing specifically for Christmas spending represents nearly one in five households going into debt for presents and food. And with credit card APRs hitting 36.34% by late 2025, that borrowed money costs considerably more to pay back than it did even two years earlier.
What January Actually Looks Like
The post-Christmas financial hangover got progressively worse across the three years:
January 2024 (post-2023 Christmas):
- £9 billion total post-Christmas debt
- Average unsecured debt per person seeking help: £14,654
- 28% of households “not coping financially”
January 2025 (post-2024 Christmas):
- £1.1 billion credit card spike in single month
- Average unsecured debt climbed to £15,672
- Arrears averaged £3,911 per struggling household (up 25% year-on-year)
- Debt-to-income ratio hit 118%
January 2026 (post-2025 Christmas):
- Total UK household debt reached £2 trillion
- 17% of households in negative budgets (spending more than earning)
- Average monthly deficit: -£343
- Debt charity calls up 29%
- 9 million people struggling with repayments
The TUC warned of a “debt timebomb” with projections showing average household debt reaching £17,179 by end of 2026. That warning came after seeing three consecutive years of deteriorating numbers.
How Overspending Patterns Changed
The impulse buying problem didn’t disappear—it evolved. People still overspent, but where and why shifted noticeably.
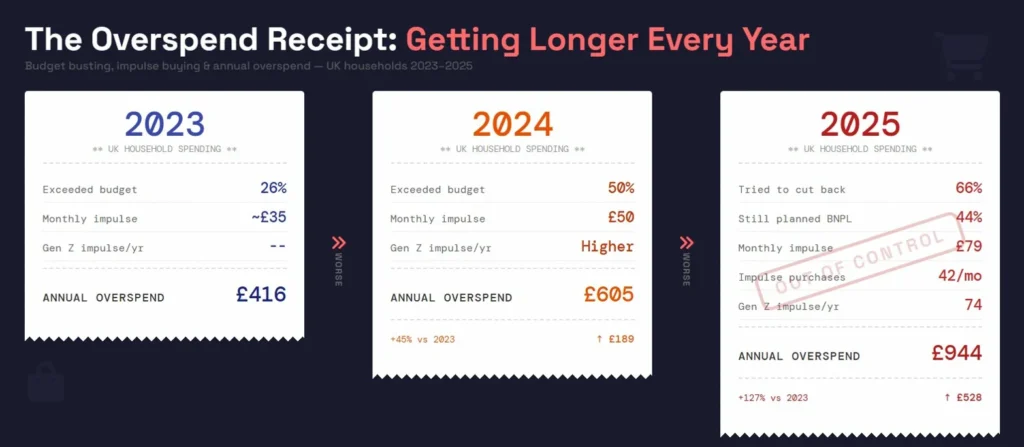
The average overspend more than doubled from £416 to £944 annually across the period. Gen Z drove much of this, averaging 74 impulse purchases per year in 2025—nearly double older demographics.
What Triggers the Spending
The reasons people gave for unplanned purchases shifted over the three years:
- Social media influence: Rose to 56% by 2025 (from “emotional triggers” in 2023)
- Deals and discounts: Consistent at 47% throughout
- Food and snacks: 51% (often not tracked as “shopping” but adds up)
- FOMO: 25% in 2024
- Boredom: 19% (2023 data)
Social media emerged as the dominant trigger by 2025, with platforms pushing products directly into feeds. The 47% responding to deals stayed constant, but the difference was how people started preparing for those deals rather than reacting to them.
The Black Friday Transformation
Three years of Black Friday data shows the shift from panic buying to planned purchasing more clearly than any other metric.
Transaction volume hit record highs in 2025, but average order values barely moved. People made more purchases of smaller items rather than splashing out on big-ticket products. The days of buying a television just because it’s discounted are fading—2025 shoppers bought televisions because they needed one and waited three months for Black Friday pricing.
The “Calculated Consumer” Behaviours
By 2025, distinct patterns had emerged:
- 30% wish-listed specific items weeks in advance
- 18% deliberately left items in online baskets waiting for price-drop emails
- 19% used Black Friday specifically for essentials they needed anyway
- 68% expressed scepticism that deals were genuine
- 34% admitted spontaneous deal hunting in 2023, but this dropped significantly by 2025
The shift from impulse to strategy happened because people got burned. BNPL debt, credit card interest, and January regret taught shoppers to plan rather than react.
Where the Money Went
Top spending categories remained fairly consistent but with some notable shifts:
| Rank | Category | Share of Spend | Notes |
|---|---|---|---|
| 1 | Technology & Electronics | 48% | TVs, consoles, headphones still dominate |
| 2 | Fashion & Clothing | 38% | Winter coats, party wear (high return rates) |
| 3 | Health & Beauty | 28% | Fastest growing—skincare, premium toiletries |
| 4 | Home & Garden | ~25% | Air fryers peaked 2023/24, coffee machines rising |
| 5 | Gifting/Stocking Fillers | ~20% | Lower value, bought early |
Average basket values told an interesting story: luxury items averaged £83.65, home items £55.55, but general average transaction value sat at just £46.57. Shoppers made more small purchases rather than single large ones.
Online vs High Street Split
The channel breakdown showed mobile dominance accelerating:
- Online share: 60-68% of total Black Friday spend
- Mobile shopping: 56% of online purchases in 2024 (record)
- In-store footfall: Actually increased 4.8% in 2024
- Click-and-collect: Up 21%, nearly 1 in 10 orders
The footfall increase surprised analysts—people wanted to see products before buying, but final purchases often happened online anyway. Click-and-collect growth reflected shoppers avoiding delivery fees while still shopping digitally.
How Britain Pays Now
Payment method data from Black Friday 2024 showed significant shifts from traditional card spending toward digital alternatives.
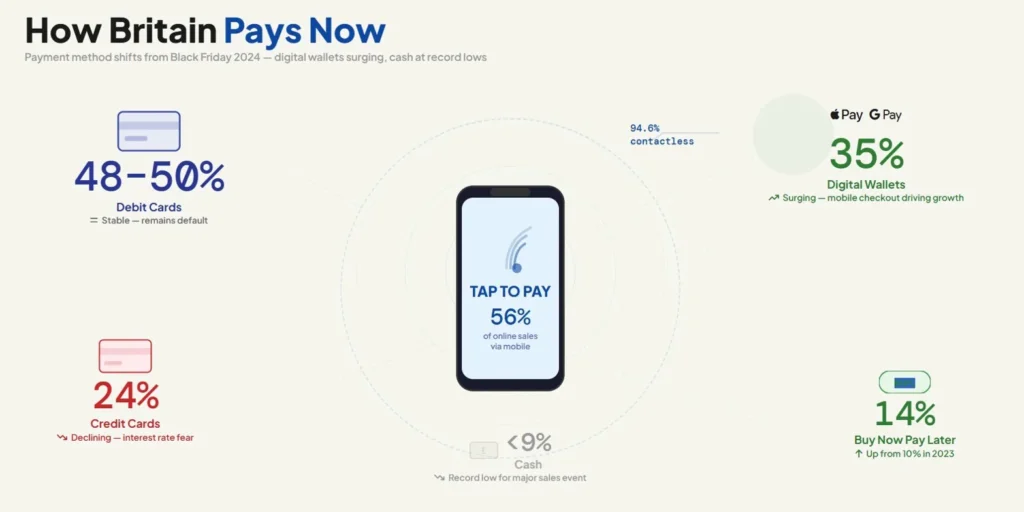
Contactless hit 94.6% of all eligible in-store card transactions. The mobile dominance (56% of online sales) directly fuelled digital wallet adoption because typing card numbers on phone screens is friction nobody wants.
The BNPL Reality
Buy Now Pay Later became mainstream across 2023-2025, but the consequences became clearer too.
Scale of usage:
- £117.2 million spent via BNPL on Black Friday 2024 alone
- £3.6 billion across the full holiday season (November-December)
- BNPL share rose from 10% (2023) to 14% (2024)
Who uses it:
- Gen Z: 53% usage rate (highest adoption)
- 55-64 age group: Doubled to 21% (fastest growth)
- BNPL users spent 72% more per transaction than immediate payment users
The problem side:
- 34-41% of BNPL users missed at least one payment in the previous 12 months
- “Debt stacking” emerged as major concern—shoppers using multiple providers, losing track of total amounts owed
- Financial charities flagged BNPL as contributing to the January debt crisis
Early 2025 data showed a pullback to around 12% BNPL share. Shoppers appeared to be learning from the “debt hangover” experienced in January 2024 and January 2025, preferring to spend only what they actually had.
Gift Cards Became Budgeting Tools
One of the more surprising trends across 2024-2025 was gift cards shifting from presents for others to spending controls for self.
Key statistics:
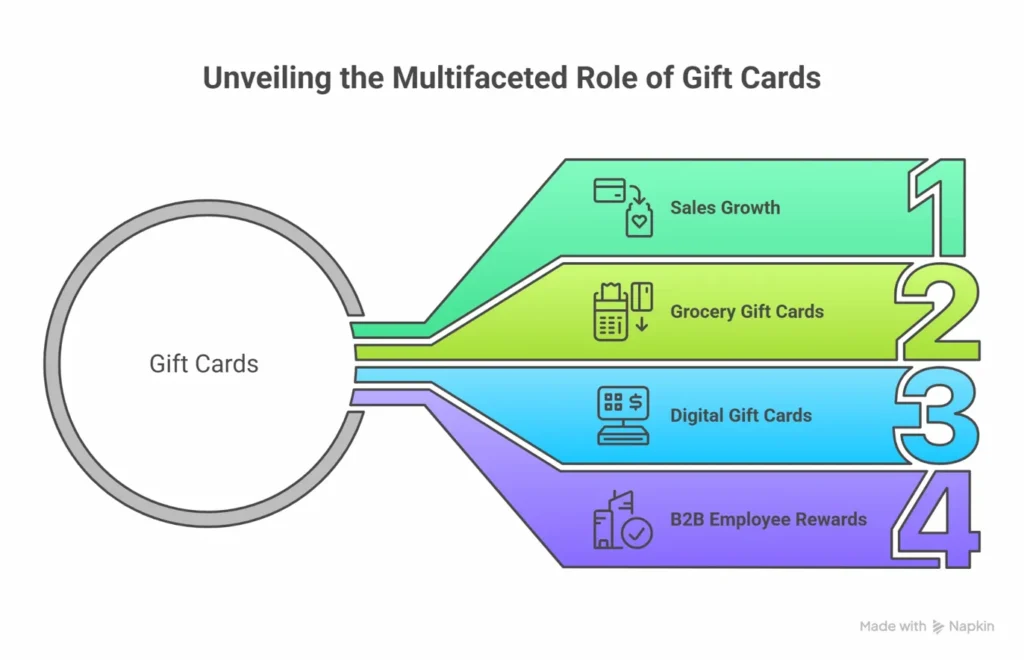
- Gift card sales jumped 11% in H2 2024
- Grocery gift cards grew 20% (fastest category)
- Digital gift cards exceeded 50% market share for first time
- B2B employee reward cards up 13.7%
The grocery card growth tells the story. People started buying fixed-value supermarket cards for themselves or family members specifically to cap food spending. When the card hits zero, shopping stops—no creeping past budget, no “just one more thing” at checkout.
Fixed-Value Payments as Strategy
This same psychology applies across categories. Prepaid and fixed-value options remove the open-ended nature of card spending that makes overspend easy.
The principle works for digital purchases too. Options like Eneba – virtual Visa gift card let shoppers set hard limits on gaming, subscriptions, or digital entertainment spending. Load a specific amount, use it across multiple platforms, and when it’s gone, it’s gone. No January surprise when the credit card statement arrives.
For the 19% who borrowed for Christmas 2025 and the 47% taking more than six months to repay, these fixed-ceiling approaches offer a way to participate in sales without the debt accumulation that followed previous years.
Boxing Day and January: Fewer Shoppers, Higher Spend
The post-Christmas sales showed a clear pattern: participation dropped but those who did shop spent more intentionally.
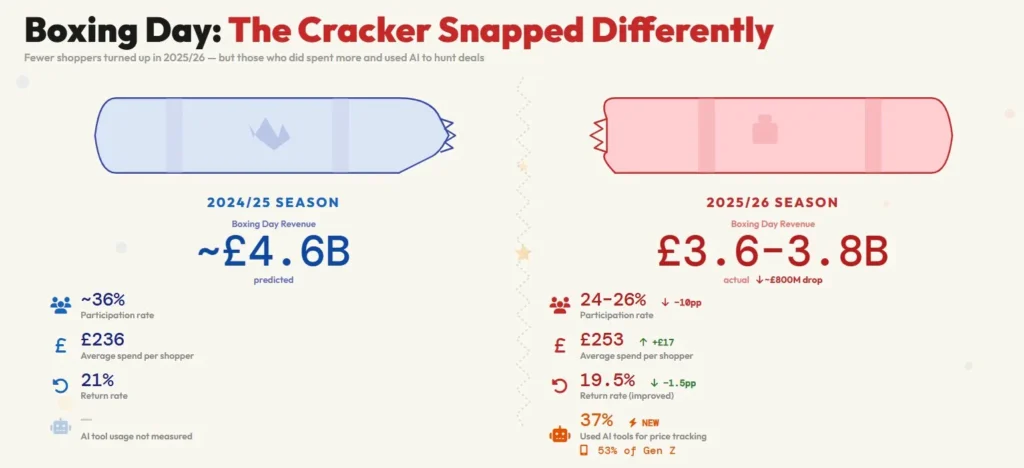
The drop from 36% to 24-26% participation is significant—roughly a third fewer people bothering with Boxing Day sales. But those who did participate spent £17 more on average, suggesting intentional purchases rather than browsing that turned into buying.
Returns: The £27 Billion Problem
Return rates told their own story across the period:
| Year | Overall Return Rate | Fashion Returns | Key Driver |
|---|---|---|---|
| 2023 | 12-20% | 39% | Post-pandemic normalisation |
| 2024 | 20% average | 26% | “Bracketing” (buying multiple sizes) |
| 2025 | 19.5% | 30% | Serial returners (11% of shoppers drove 24% of returns) |
Total returns hit £27 billion in 2025, driven largely by serial returners—11% of shoppers responsible for nearly a quarter of all returned items. Retailers responded with return fees (Zara, H&M, Next), which contributed to the slight rate drop from 21% to 19.5%.
Most commonly returned categories remained consistent:
- Clothing: 27%
- Shoes: 15%
- Bags/accessories: 14%
Regret rates hovered around 50% throughout—roughly half of impulse purchases led to some form of buyer’s remorse, though this dipped slightly to 48% in 2025 as more purchases became planned rather than spontaneous.
Other Sales Events: The Broader Picture
Black Friday dominates headlines, but other sales periods showed similar patterns.
Amazon Prime Day
- 2025 expanded to 4 days, saw 11.1% sales increase vs 2024
- Categories: electronics, home goods, kids’ apparel led growth
- Average order values faced downward pressure despite total growth
Easter 2025
- April retail volumes up 1.2%
- Chocolate/confectionery spend rose 10%
- Supermarket promotions hit £2.6 billion (highest in several years)
- Late Easter timing boosted April figures
Back-to-School
- 2024: Average £92 per child on uniforms
- 2025: Average £329 per child (total school items including tech)
- Market spending up 18%, driven by technology and social media influence on what kids “need”
Gaming and Digital Entertainment (Black Friday)
- PS5 dominated 2025 with 62% console market share
- Console units up 7%, revenue up 14%
- PS5 specifically up 16% units vs 2024
- Digital console sales grew 3.5% to £2.45 billion
- Overall gaming market: £7.6 billion (slight dip from £7.82B in 2023)
- Physical game sales down 34%—digital shift accelerating
E-commerce: The Underlying Shift
Total UK e-commerce provides context for the sales event data:
| Year | Total Online Spending | Mobile Share | Online % of Retail |
|---|---|---|---|
| 2022 | £118.5B | 55% | ~20% |
| 2023 | £123.3B | 57% | ~25% |
| 2024 | £127-129B | 59% | ~26% |
| 2025 | Projected £130B+ | 60% est | ~27-28% |
Growth rates stabilised at 3-5% annually after the pandemic surge and subsequent correction. Mobile purchasing crossed 59% and continues climbing, which explains why digital wallets and streamlined checkout options gained so much ground.
What Three Years Taught UK Shoppers
The data points toward several behavioural shifts that seem likely to stick:
- Planning took the role of acting on impulse. The 30% of people who wish-list things and the 18% who use basket abandonment strategies are examples of learned behavior from past debt experiences. Once these behaviors are created, they tend to stay.
- Skepticism became the norm. When 68% of shoppers don’t believe that offers are real, stores have to be honest about their prices. The “was £100, now £50” method doesn’t work as well on people who have been burned before.
- Spending a set amount to protect yourself. The 11% rise in gift card sales, especially the 20% rise in food cards for personal use, suggests that customers are looking for ways to cut back on their spending. This includes prepaid cards, digital wallets with specified limitations, and apps that help you keep track of your spending.
- There is growing opposition to BNPL. The drop from 14% to a projected 12% share, along with the 34% to 41% missed payment rates, shows that BNPL’s development era may be coming to an end. Regulation is on the way, and buyers are finding out the hard way that “buy now” implies “pay later.”
- Less participation, more intentionality. Fewer people are interested in Boxing Day (24–26% vs. 36%), but those who do spend more on average, which implies that there is a difference between people who are looking for deals and people who are just browsing.
The TUC’s warning about a “debt timebomb” is important because the statistics have been going up for three years. But the behavioral data gives us some hope: buyers are changing their habits, making more plans, and looking for ways to reduce their spending instead of just spending less. As we approach into 2026, the issue remains whether that adaptation will happen quickly enough to make up for the debt that has built up.
