
This article is not a financial advice! The ideas are based on factual data, research and my opinion.
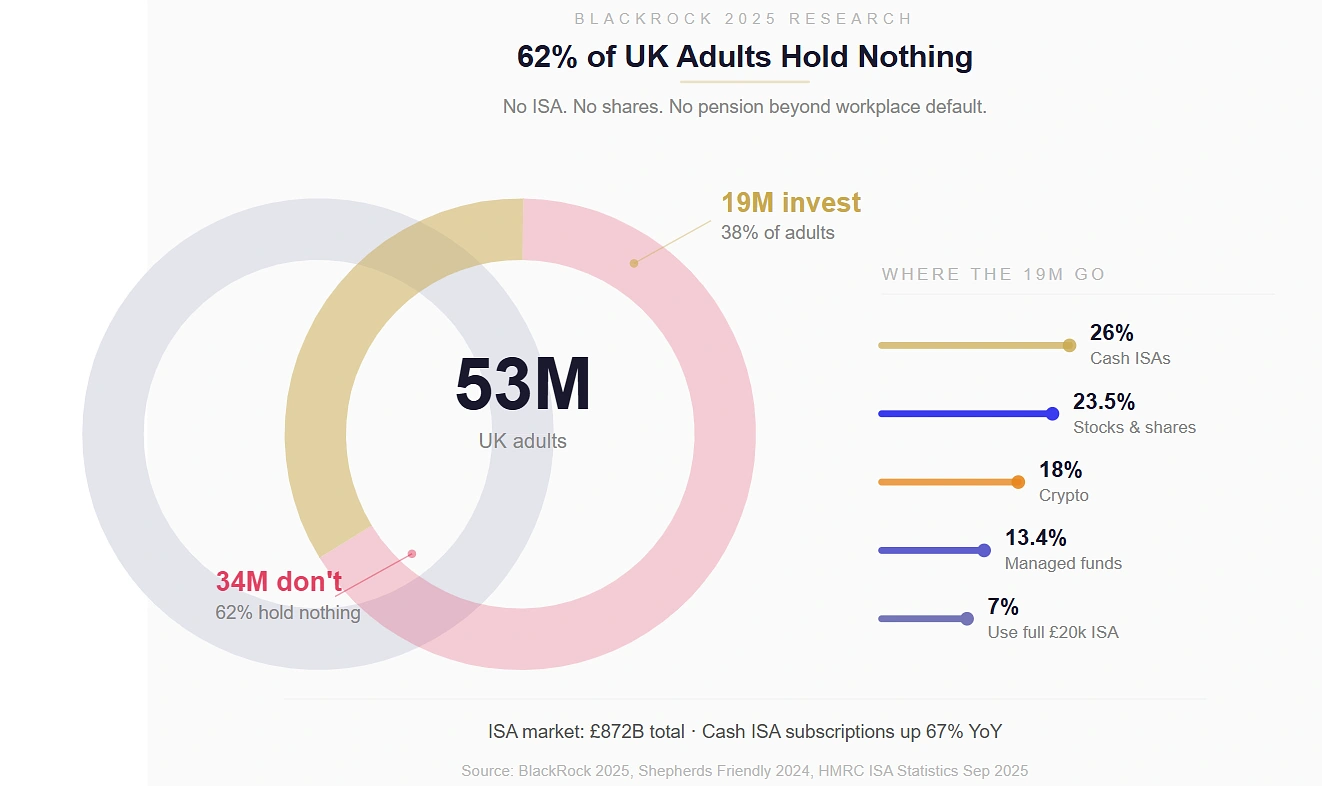
Between 2020 and 2025, roughly 19 million adults held some form of investment beyond a current account. The other 34 million — 62% of the adult population — held nothing at all, according to BlackRock’s 2025 research. No ISA, no shares, no pension beyond the workplace default. Just cash sitting in accounts earning whatever the bank felt like offering that month.
For the 19 million who did put money somewhere, the question that matters now isn’t theory. It’s arithmetic. What actually happened to a thousand pounds depending on where it landed five years ago?
| Where you put it (Jan 2020) | Approximate value by late 2025 | Real return after inflation | Risk level |
| Cash ISA (avg rates) | ~£1,025 | Negative (purchasing power fell) | Very low |
| FTSE 100 tracker (with dividends) | ~£1,300 | Modest positive (~5-8% real) | Medium |
| S&P 500 tracker (USD) | ~£2,000 | Strong positive (~70-80% real) | Medium-high |
| Property (leveraged via deposit) | Equity ~3x original deposit | Strong positive (leveraged) | Medium (illiquid) |
| Bitcoin (held throughout) | ~£14,000-£15,000 | Extreme positive | Very high |
| Bitcoin (bought Nov 2021 peak) | ~£1,500-£1,700 | Modest positive after deep losses | Very high |
The answers aren’t comfortable for everyone.
This content has been fact-checked by the team at 1red — thanks to them for helping us verify the data referenced in this report.
Cash ISAs — Safe, Simple, and Quietly Eaten Alive
Cash ISAs were the most popular choice throughout the entire period. 26% of investors picked them as their primary vehicle, according to Shepherds Friendly’s 2024 investment report. The appeal was obvious — tax-free interest, capital protection, no risk of losing the original amount.
The problem was the returns. Between 2020 and early 2022, the Bank of England base rate sat at 0.1%. Cash ISA rates followed it to the floor. A fixed-rate ISA in 2021 might have offered 0.5% if you were lucky. That meant £1,000 deposited in early 2020 grew to roughly £1,025 by 2025 before inflation was accounted for.
And inflation is where the story turns sour. CPI averaged around 5.2% annually between mid-2021 and late 2023 during the cost-of-living spike. In real purchasing power, that £1,025 was worth closer to £850-£870 in 2020 terms. The balance went up. What it could buy went down.
Rates improved significantly from late 2022 onward as the base rate climbed to 5.25% before settling at 3.75% by early 2026. Fixed-rate Cash ISAs now sit around 3.97%. But someone who parked money in cash throughout the entire five-year window lost purchasing power even though the number in their account grew. The maths doesn’t lie, even when the statement looks reassuring.
The ISA market hit £872 billion in total value by 2023-24, growing 20.1% year-on-year according to HMRC. Cash ISA subscriptions surged 67% in a single year. People trust them. They should — just not as a growth vehicle.
Stocks and Shares — The Bumpy Ride That Mostly Paid Off
23.5% of investors chose stocks and shares directly, with another 13.4% going through managed funds. The experience depended enormously on what you bought and when you bought it.
The FTSE 100 started 2020 at around 7,600, crashed to 5,190 during the March pandemic sell-off (a 32% drop in weeks), and spent the next four years clawing back. By the end of 2025, it sat around 8,300-8,400 — roughly 10-12% above where it started, plus dividends averaging around 3.5% annually.
So £1,000 in a FTSE 100 tracker in January 2020 became approximately £1,280-£1,320 by late 2025 with dividends reinvested. Not spectacular, but ahead of inflation over the full period.
The real action was elsewhere. Investors who put money into US equities — specifically the S&P 500 — saw dramatically better returns. The S&P 500 roughly doubled over the same five-year window, meaning £1,000 invested in a US tracker became approximately £1,900-£2,100 depending on currency movements.
And this is exactly what happened on a mass scale. British investors have been steadily abandoning domestic equities in favour of American ones. Allocation to UK stocks fell from 29.6% in 2008 to just 11.5% by 2023 — a quiet exodus that fund managers and financial commentators have spent years trying to reverse without much success.
The FCA’s Financial Lives Survey found that 21% of current investors started in the last three years — a wave of newcomers drawn in by investing apps and social media. But the same research found that 75% of retail investors in meme stocks lost money, and 42% of people who invested based on social media advice ended up worse off. The tool matters less than the homework behind it.
Property — The One Everyone Thinks About First
Property sits in its own category because most people who “invest” in property are buying a home to live in rather than treating it as an investment vehicle. But the numbers over five years are worth seeing anyway.
Average house prices rose from roughly £231,000 in early 2020 to around £290,000 by late 2025, according to Nationwide and ONS data. That’s approximately 25% growth — significantly ahead of inflation, though the path wasn’t smooth. Prices surged during 2021-22, wobbled when mortgage rates spiked in late 2022, and have been recovering unevenly since.
Someone who put a £25,000 deposit on a £250,000 property in 2020 is sitting on a home worth roughly £310,000 by 2025. Their equity grew from £25,000 to approximately £85,000 — a return of 240% on the deposit itself, levered by the mortgage. That’s why property feels like such a good investment even when the headline percentage growth is modest.
The catch is liquidity. Selling a house takes months, costs thousands in fees, and you need somewhere else to live. It’s not comparable to selling shares on a Tuesday afternoon because you need the cash. Rising mortgage rates also mean the cost of holding property is higher than it was five years ago, which eats into real returns for anyone who remortgaged at 5-6% rather than the 1.5% deals that were available in 2021.
Crypto — The Widest Range of Outcomes Imaginable
18% of investors held cryptocurrency by 2024, according to Gemini’s research. Among high earners (over £150,000), that figure rose to 43% — making crypto the joint most popular asset class alongside traditional shares for the wealthiest bracket.
The five-year returns are almost impossible to generalise because the range is so extreme. Bitcoin started 2020 at roughly £5,300, hit £48,000 in late 2021, crashed to £13,000 in 2022, and sat around £75,000-£80,000 by early 2026. Someone who held from January 2020 to April 2026 turned £1,000 into approximately £14,000-£15,000.
But the reality for most crypto investors was nothing like that. The FCA found that the “new investor” wave of 2021-2023 — people who jumped in during the hype — disproportionately bought near peaks and sold during crashes. Crypto scams surged from 40% to 66% of all investment fraud reports between 2023 and 2025 according to Action Fraud data. The losses weren’t just from market volatility. They were from outright theft.
Crypto occupies a strange position in household finance. For a small number of early, patient holders, it generated life-changing returns. For a much larger number of late, impulsive buyers, it generated losses and frustration. Both of those things are simultaneously true, which is why crypto conversations tend to produce more heat than light.
What £1,000 Actually Became — The Summary
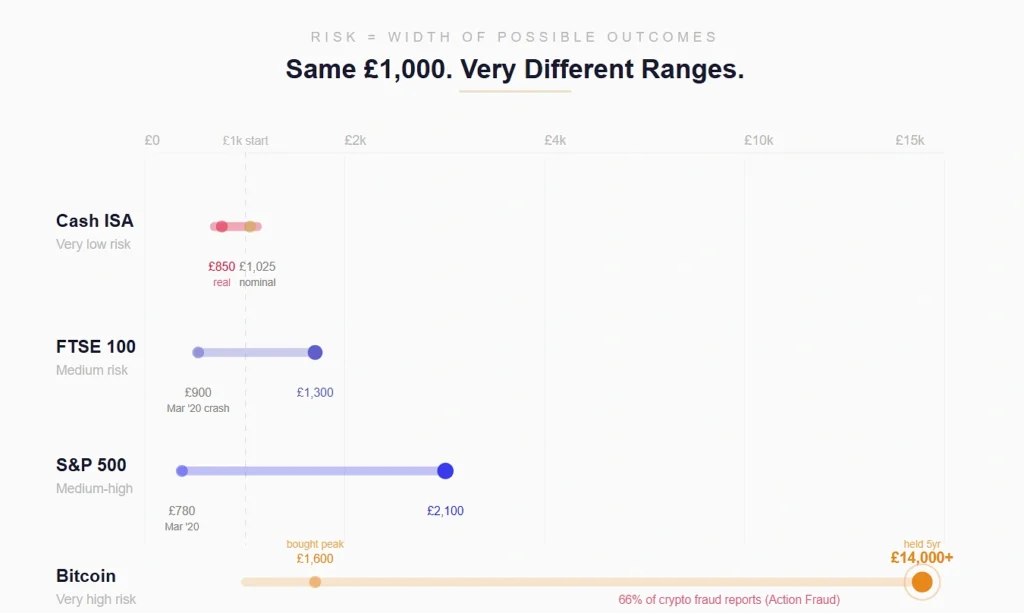
The spread between best and worst is enormous. The same £1,000 became anywhere from £850 in real terms (cash ISA during high inflation) to £15,000 (Bitcoin held from early 2020). That gap is the entire reason financial decisions feel so high-stakes even when the amounts involved are modest.
What the Data Actually Tells Us Going Into 2026
62% of adults still don’t invest at all. That figure from BlackRock’s research is the single most important number in this entire article. Not because everyone should be investing — some people genuinely can’t afford to, and that’s a structural problem, not a personal failing. But for the portion of that 62% who have spare cash sitting in a current account earning nothing, the five-year evidence is clear: cash that doesn’t move loses value.
ISAs are more popular than ever but mostly cash ones. The total ISA market hit £872 billion, but only 7% of holders use their full £20,000 annual allowance. Cash ISAs surged 67% in subscriptions, partly because rates finally became respectable. But with inflation still above the base rate, the gap between “safe” and “growing” remains real.
The shift toward US equities is accelerating. British investors are putting less into British companies every year. Whether that’s a rational response to better returns abroad or a slow-motion problem for domestic capital markets depends on your perspective. Probably both.
New investors are more vulnerable. One in five current investors started in the last three years, often through apps and social media. The FCA’s data on meme stock losses and social media-driven decisions suggests the barrier to entry dropped faster than financial literacy rose.
None of this is advice. It’s arithmetic. What anyone does with the arithmetic is between them, their circumstances, and — if the amounts are significant — a qualified financial adviser who’s paid to give a damn about the outcome.
Data sourced from FCA Financial Lives Survey 2024, HMRC ISA statistics (September 2025), BlackRock Bridging the Gap report 2025, Shepherds Friendly UK Investment Report 2024, ONS house price data, Nationwide House Price Index, Action Fraud investment fraud statistics, and Gemini UK crypto adoption research. Past performance is not a reliable indicator of future returns. Capital at risk with all investments except FSCS-protected cash deposits. Consider seeking independent financial advice.
